

Practical exercise 1: HABITABLE ZONE
In this practical activity, the students will use a heat source and a thermometer to investigate how the surface temperature of an exoplanet changes with distance from its host star. By using thermometers with bulbs with different reflectivity, the students will also appreciate the effect which the surface albedo has on the planet’s temper ature. The main objective is for the students to grasp the basic idea that there are regions of both high and low temperature around the host star, including a certain region (the habitable or “Goldilocks” zone), where the temperature is just right to sust ain liquid water on planet’s surface.
Materials needed
Radiant heat source, two thermometers (one with a blackened bulb, one with a shiny bulb), laboratory stand with clamps, meter rule, graph paper
Warm up questions
Q: Should the surface temperature of an exoplanet increase or decrease with distance from its host
star? Why?
A: It decreases because the power received by a unit of area from an isotropically emitting source
(the host star) decreases with the square of distance from the source. See Figure 1 below.
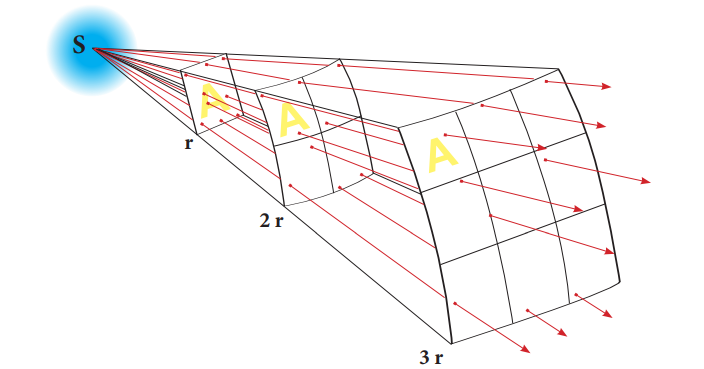
Figure 5: Inverse square law for radiation. Source:wikipedia
Q: How should the temperature of an exoplanet be affected by the reflectivity of its surface?
A: The more reflective the surface is (i.e. the higher the albedo), the more power captured by the
exoplanet is sent back into space, that is, the less energy is absorbed by the exoplanet and therefore
the smaller its temperature.
Q: What is the effect of a n atmosphere on exoplanet’s temperature?
A: The atmosphere sends back some of the energy reflected or radiated by the surface away into
space. Hence it serves to “retain” the energy within the system, thereby increasing the planet’s
temperature. This is es sentially the idea behind the greenhouse effect. See Figure 2 below.
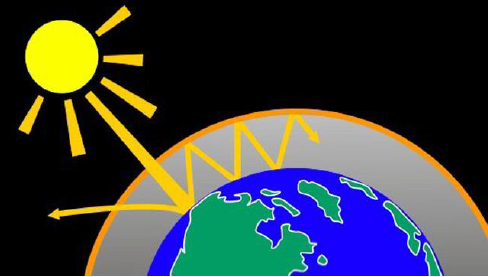
Figure 6: Greenhouse effect.
Source: https://www.wonderworksonline.com/
Q: What is the “habitable zone”?nbsp;
A: It is a range of distances from the host star where exoplanets, given sufficient atmospheric pressure, can support liquid water on their surface. The required interval of surface temperatures is therefore roughly 0 °C 100 °C (depending on the precise value of atmospheric pressure) pressure). As a consequence of the dependence of the exoplanet’s temperature on the properties of its surface and atmosphere , the boundaries of habitable zone are not sharply defined.
Q: Which planets of our solar system lie inside Sun’s habitable zone?nbsp;
A: It is the Earth only. While the distance of Venus from the Sun is not too small, the high abundance of greenhouse gasses in its atmosphere result in conditions which cannot sustain liqu id water on its surface. On the other hand, Mars lies just outside the outer boundary of the solar habitable zone. Due to its thin atmosphere, most of the water on Mars is locked up as ice in its polar caps. Possible seasonal presence of liquid water is, however, not excluded.
Q: Use the internet to search for exoplanets which lie in the habitable zone of their host stars. Record as many available data about the exoplanets and their host stars as possible.
A: As of August 2018 we have roughly 40 confirmed exoplanets orbiting their host star within habitable zone.
Q: Why is liquid water a necessary ingredient for formation of life?nbsp;
A: Many substances necessary for life can dissolve in liquid water, which can mediate their transport and absorption.
Q: What implications does the evolution of stars have on the habitable zone?
A: Ordinary (the so called “main sequence”) stars, to which our Sun belongs, become increasingly more luminous as they become older. This means that for a given star, the boundaries o f its habitable zone gradually shift further away as the star ages. As a consequence, planets on stable orbits generally become hotter.
Q: What type of planets (in terms of their chemical composition) would you expect to find close to their host stars? What type of planets would you expect to find further apart from the star? How do your answers compare with the currently available observational data?nbsp;
A: Rocky planets are expected form closest to their host star, while the gas giants and icy bodies should be expected at farther distances. This is because during the period of planet’s formation, the elements such as silicon and iron (which the rocky planets are composed of) were allowed to condense at much higher temperatures than more volatile elements such as hydrogen and helium (the main components of gas giants). Abundant appearance of the so called “hot Jupiters” suggested by current observations therefore does not fall into this scheme and more complicated astrodynamical theories involving “planetary migration” have to be invoked. Instructions.
Instructions
Students will use two types of thermometer to measure the temperature as it changes depending on the distance from a radiant heat source. One thermometer should have its bulb blackened to eliminate as much reflection as possible, while the other should hav e a shiny bulb (e.g. wrapped into a piece of aluminium foil) to reflect more radiation away. As a consequence the shiny thermometer should show lower readings than the blackened one.
The detailed instructions for the students are as follows:
1. Using a pair of clamps, affix the two thermometers to a laboratory stand.
2. Move the stand to a distance of 1 m away from the radiant heat source.
3. Wait until the thermometer readings stabilise and record the temperature measured by both thermometers.
4. Repeat for smaller distances. We suggest that you decrease the distance by 5 cm at a time. You should stop at a distance where the temperature readings exceed the limit of your thermometers.
5.On a graph paper, draw the measured temperature against the distance from the heat source.Results for both thermometers should be included into a single plot. Put the distance (in cm) on the horizontal axis and the measured temperature (in\\°C ) on the vertical
axis.
6. Fit two smooth curves through the data points recorded by the two thermometers.
The following questions should be answered by the students after completing the practical activity
Q: How does the measured temperature change with distance from the heat source? Does it meet your expectations?nbsp;
A: The students should find that the temperature indeed decreases with distance, as we have discussed above.
Q: What can be said about the effect of reflectance of the thermometer bulb on the recorded temperature?nbsp;
A: The students should find that the curve they plotted for the blackened thermometer lies above the curve plotted for the shiny thermometer. The effect of higher reflectance is therefore towards decreasing the temperature readings.
Q: What temperature do the measured temperature curves approach for large distances?nbsp;
A: The current room temperature.
Q: What temperature do you expect the curves would approach for a real exoplanet?nbsp;
A: The absolute zero, roughly 270 °C.