

Practical exercise 2: CONNECTION BETWEEN WAVELENGTH AND FREQUENCY OF
Aim
Students will discover and verify the relationship between Wavelength and Frequency of the Electromagnetic Spectrum.
Necessary materials
Graphic depicting the electromagnetic spectrum. (Click image for a larger version.)
• Teacher
• roll of adding machine tape
• For each triad of students
• set of red, green and violet (purple) pencils
• manila folder
• meter stick or metric ruler
• pair of scissors
• 4 books
• watch with second hand
• one strip of masking tape
• extra pencil
• handouts
▪ 1 procedure worksheet (Word, PDF) ▪ 1 data table ( Word, PDF)
▪ 3 wrap-up worksheets (Word, PDF)
Background
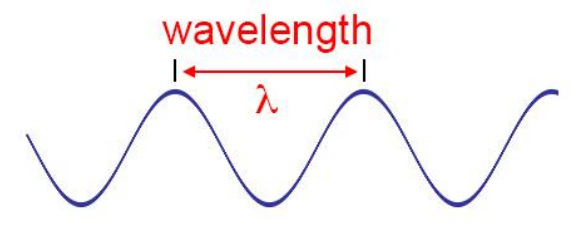
Diagram showing what wavelength is for a wave. (Credit: NASA's Imagine the Universe)
Tells students that frequency is the number of complete waves, or wavelengths, that pass a given point each second. All light travels at the same speed, but each color has a different wavelength and frequency. It is their different wavelengths that cause the different colors of light to separate and become visible when passing through a prism.
Show students the illustration below, or something similar.
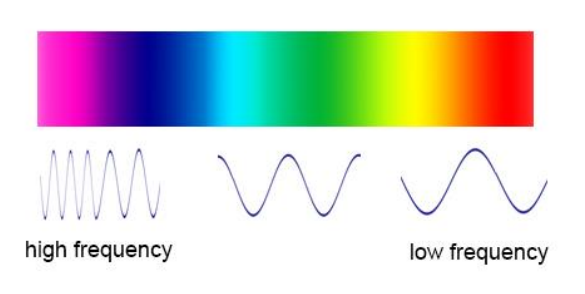
Diagram showing the relative frequency of the different parts of the visible spectrum. The waves are not shown to scale. (Credit: NASA's Imagine the Universe)
Ask students, based on the illustration above, to guess which color has the longest wavelength? The answer is red. The wavelengths of the other colors decrease in order, with violet light having the shortest wavelength.
Tell students that in this hands-on lab, they will construct a simplified model of different light waves in order to determine a constant relationship between wavelength and frequency.
Procedure
Hand out the procedure sheet to each group in order for them to see the instructions along with hearing them.
1. Triad decides who is:
• Data Keeper / Reader
• Materials Manager / Checker
• Time Keeper / Facilitator
2. Materials Manager retrieves all materials listed from teacher. Reader should read all directions.
3. Recorder should draw a vertical line about 20 cm from the beginning of the adding machine tape and label it "Start". With the metric ruler, make a point 100 cm from the starting point. Draw a vertical line and label it "End". Cut the tape off of the roll leaving about 20 cm space between "End" and where you cut.
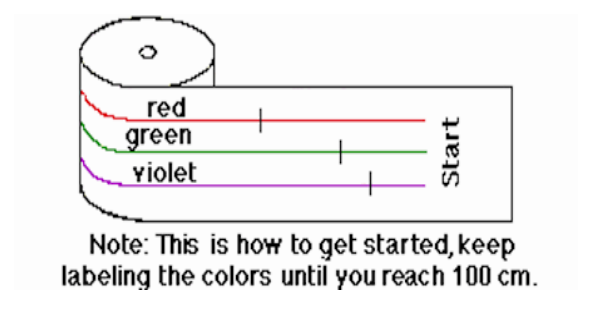
Diagram showing how to label the tape. (Credit: NASA's Imagine the Universe)
4. Next, Materials Manager draws three evenly spaced horizontal lines using colored pencils to draw along the tape from Start to End. Make the top line red, the middle line green and the bottom line violet to represent three different colors in the spectrum of light.
Note: The Time Keeper/ On Task Coordinator should continually keep everyone focused in order to complete this lab. He or she may also share in the completion of the tasks.
5.
6. Recorder divides the red line every 14 cm with dark marks in red pencil. The
green line should be divided every 10 cm and the violet every 8 cm. The marks that you make on the three color lines will represent the different wavelengths of the different colors of light.
Note: The true wavelengths are actually measured in terms of angstroms. An angstrom is 10-8 cm or 0.00000001 cm. Red has a wavelength of 7800-6220 angstroms, green has a wavelength of 5770-4920 angstroms and violet has a wavelength of 4550-3900 angstroms. However, in this lab, the simple relationship among the visible light waves will be what is important.
7.
8. Materials Manager fastens the marked adding machine tape to a pencil using masking
tape.
9. Recorder cuts a manila folder along its crease. Then cuts a rectangle out of the center
of one of the long sides. This rectangle should be about 10 cm high and 5 cm wide as shown below.
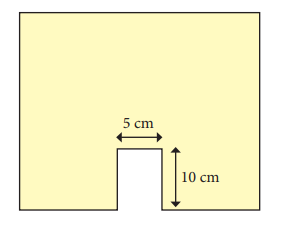
Diagram showing the cutout on the manila folder should look. (Credit: NASA's Imagine the Universe)
10. Materials Manager sets the manila folder with the cut out on the table, supporting it with the four books as shown in the diagram below. Now s/he feeds the end of the adding machine tape through the narrow space between the manila folder and the two back books until "Start" appears in the middle of the opening in the manila folder.
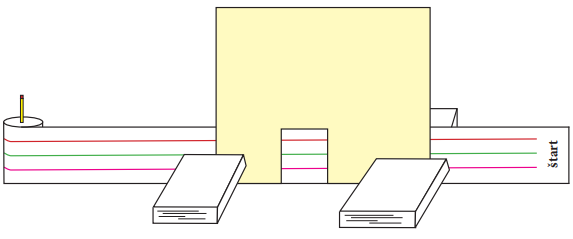
Diagram showing the setup for this lab. (Credit: NASA's Imagine the Universe)
11. Recorder takes the Data Table and sits in front of the tape and manila folder model.
12. Time Keeper calls "start" and begin timing as he or she slowly pulls the tape along.
S/he should try to pull the tape at about the same speed for every trial!
13. Recorder tallies in the appropriate box on the data table every time s/he sees a wavelength mark. When "End" appears, s/he tells the Time Keeper to stop timing.
14. Each Triad makes one "trial run" and then repeats the procedure an additional 3 times.
15. On the data table, Materials Manager determines and records the average number of wavelengths observed for each color and the average time (in seconds) from start to
finish.
16. Recorder determines and records the frequency for each of the colored light waves.
Note: frequency is defined as the number of wavelengths passing a given point per second.