

Practical exercise 2: DWARF PLANETS AND THEIR TRAJECTORIES
Exercise: Determine the distances of dwarf planets. Order dwarf planets ascending in the distance from the Sun in perihelion and in aphelion. For each object calculate the sum of distances in perihelion and aphelion. Compare the final sum with the double of the semi-major axis.
(Clue: Distance in perihelion is a(1 – e), v odslní a(1 – e), in aphelion a(1 + e).)
Answer:
| Name | Semi-major axis a (au) |
Trajectory Eccentricity e (–) |
Distance in Perihelion rP (au) |
Distance in Aphelion rP (au) |
rP + rA (au) |
2a (au) |
| Ceres | 2,77 | 0,0758 | 2,56 | 2,98 | 5,54 | 5,54 |
| Pluto | 39,5 | 0,2488 | 29,7 | 49,3 | 79 | 79 |
| Haumea | 43,2 | 0,191 | 34,9 | 51,5 | 86,4 | 86,5 |
| Makemake | 45,7 | 0,156 | 38,6 | 52,8 | 91,4 | 91,4 |
| Eris | 67,8 | 0,441 | 37,9 | 97,7 | 135,6 | 135,6 |
Most objects of the Solar System orbit off the plane of the ecliptic in which Earth orbits the Sun. Orbital plane of an object and the basic plane of the ecliptic form an angle which we call i, from the word inclination (trajectory tilt). We will try to count also the influence of the inclination of the object’s orbital plane. For this task we will need the trigonometric functions sine and cosine.
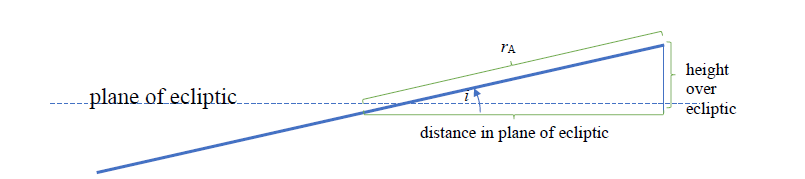
Exercise: Determine the distances of dwarf planets in perihelion and aphelion, if we project them into the plane of the ecliptic and take into consideration also the inclination of their orbital trajectories. How far from the plane of the ecliptic will the dwarf planets get if they are in perihelion and in aphelion?
Answer:
| Name | Semi-major axis a (au) |
Trajectory Eccentricity e (–) |
Trajektory Inclination i (°) |
Distance in Perihelion in Ecliptic (au) |
Distance in Aphelion in Ecliptic (au) |
Distance from Ecliptic in Perihelion (au) |
Distance from Ecliptic in Aphelion (au) |
| Ceres | 2,77 | 0,0758 | 11 | 2,51 | 2,93 | 0,49 | 0,57 |
| Pluto | 39,5 | 0,2488 | 17 | 28,4 | 47,1 | 8,7 | 14,4 |
| Haumea | 43,2 | 0,191 | 28 | 30,8 | 45,5 | 16,4 | 24,2 |
| Makemake | 45,7 | 0,156 | 29 | 33,8 | 46,2 | 18,7 | 25,6 |
| Eris | 67,8 | 0,441 | 44 | 27,3 | 70,3 | 26,3 | 67,9 |
Distance in perihelion in the plane of the ecliptic (for Ceres):
a (1 – e) cos i = 2,77 (1 – 0,0758) cos 11° au = 2,51 au
Distance in aphelion in the plane of the ecliptic (for Ceres):
a (1 + e) cos i = 2,77 (1 + 0,0758) cos 11° au = 2,93 au
Distance from the ecliptic in perihelion (for Ceres):
a (1 – e) sin i = 2,77 (1 – 0,0758) sin 11° au = 0,49 au
Distance from the ecliptic in aphelion (for Ceres):
a (1 + e) sin i = 2,77 (1 + 0,0758) sin 11° au = 0,57 au
In reality, the situation is more complicated (we did not take into consideration for example the orientation of the orbital trajectory in space, we assumed that perihelion and aphelion are the furthest from the ecliptic). However, more exact calculations significantly exeed the knowledge at elementary school level, thus we will be satisfied with this approximate calculation.
Exercise: Dwarf planet Ceres has a radius 457 km. A bus running in Bratislava is 25 metres long. How many buses will fit into the diameter of dwarf planet Ceres?
Answer: Diameter of Ceres = 2 ∙ polomer Ceres = 2 ∙ 457 km = 914 km = 914 000 m. DLength of a bus = 25 m. Number of buses n = 914 000/25 = 36 560 pieces. More than 36 500 buses would fit in the diameter of Ceres.
Exercise: In this part, we will try to estimate the orbital speed of a dwarf planet which is located in the main asteroid belt. To make it simple, we will assume that the object moves on a circular orbital trajectory.
a) Ceres, originally considered the biggest minor planet in the main asteroid belt, now classified as a dwarf planet, orbits the Sun once in 4.6 years. Calculate how many seconds it takes dwarf planet Ceres to complete one orbit.
Answer: 1 year = 365 days ∙ 24 hours ∙ 60 minutes ∙ 60 second = 31 536 000 s. One orbit of Ceres around the Sun lasts 4,6 ∙ 31 536 000 s = 145 million seconds. It would be possible to use also the length of a tropical year (the time between two successive occurrences of the vernal equinox (the moment when the Sun apparently crosses the celestial equator moving north), which lasts 31,556,925 s; however the resulting number of seconds rounded to the nearest million will not change.
b) Ceres is located at a distance of 2.77 au from the Sun. 1 au is 150 million km. Calculate the distance of dwarf planet Ceres from the Sun in km.
Answer: Ceres is located in the distance of 2,77 ∙ 150 000 000 km = 416 miliónov km.
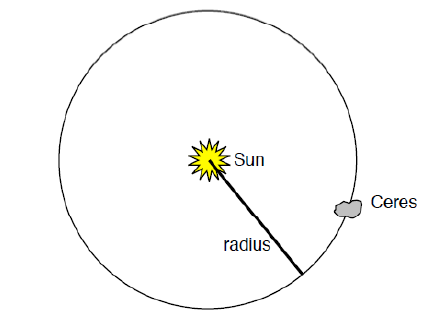
c) Assume that Ceres orbits the Sun on a circular trajectory. Draw a schematic picture which will demonstrate the orbital trajectory of this dwarf planet. In the picture draw and mark the Sun, Ceres and the radius of the circle (orbital trajectory).
Answer:
d) Use the distance from section b) and calculate how many km Ceres will travel during one orbit. (Clue: the circle circumference is calculated with the help of relation  , where
  3,14)
3,14)
Answer: The circumference of the orbital trajectory  km = 2,6 bilion km.
To compare, the length of Earth’s orbital trajectory is less than one billion km.
e) To calculate the average speed, use the relation v = s / t and with the answers from sections
a) and b) calculate the orbital speed of Ceres.
Answer: Average speed of Ceres around the Sun is v = s / t = 2,6 ∙ 109 / 145 ∙ 106 km · s–1 = 17,9 km · s–1. To compare, Earth’s average orbital speed is 30 km s–1.
Exercise: orbital speed of dwarf planet Pluto
a) Pluto, originally considered a planet, now classified as a dwarf planet, orbits the Sun once in 248 years. Calculate how many seconds it takes dwarf planet Pluto to complete one orbit.
Answer: One orbit of dwarf planet Pluto around the Sun lasts 248 ∙ 31 536 000 s = 7,8 billion seconds.
It would be possible to use also the length of a tropical year, however the resulting number of
seconds rounded to the nearest tenth of a billion will not change.
b) Calculate how many times has Pluto orbited the Sun since its discovery in 1930.
Answer: Since its discovery, Pluto will finish its orbit around the Sun only in 2178, that is,
since its discovery Pluto has not orbited the Sun a single time yet. Since its discovery, Pluto
(until 2019) has travelled 36% of its total orbital trajectory. (2019 – 1930) / 248 = 0.36.
c) Pluto is located in the average distance of 39.5 au from the Sun. 1 au is 150 million km.
Calculate the distance of dwarf planet Pluto from the Sun in km.
Answer: Pluto is located in the distance of 39.5∙150,000,000 km = 5.9 million km.
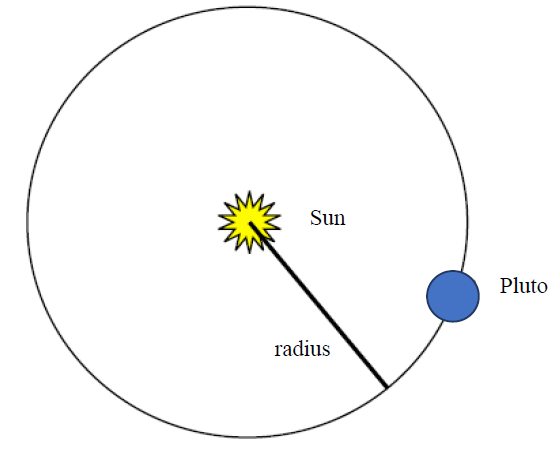
d) Assume that Pluto orbits the Sun on a circular trajectory. Draw a schematic picture which
will demonstrate the orbital trajectory of the dwarf planet. In the picture draw and mark the
Sun, Pluto and the radius of the circle (orbital trajectory).
Answer:
e) Use the distance from section c) and calculate how many km Pluto will travel in one orbit. (Clue: the circle circumference is calculated with the help of relation , where 3,14)
Answer: The circumference of the orbital trajectory  km = 37 billion km.
To compare, the length of Earth’s orbital trajectory is less than one billion km. In reality, Pluto does not travel in a circle but in an ellipse with the eccentricity 0.25. The formula to calculate the circumference of an ellipse exceeds the difficulty of elementary school curriculum. The error of determination the circumference of an ellipse using the formula for the circle circumference is approximately several per cent, thus for this purpose the substitute with the circle circumference is sufficient.
f) To calculate the average speed, use the relation v = s / t and with the answers from sections a) and e) calculate the orbital speed of Pluto.
Answer: Average speed of Pluto around the Sun is v = s / t = 37 ∙ 109 / 7,8 ∙ 109 km · s–1 = 4,7 km · s–1. To compare, Moon’s average orbital speed around Earth is 1 km s–1.
Exercise: When does Ceres set? In this exercise we will predict when dwarf planet Ceres sets, observing it with the Faulkes Telescope North (FTN) in Hawaii. Assume that the object’s set is the moment when it is in the height of 0° above the horizon.
The chart below contains the height of Ceres above the horizon as viewed from the FTN every day for the period of 21 days starting on the 27th February 2006. When we look at the data, it is obvious that the height of Ceres above the horizon gradually lowers every day. When does it reach the horizon?
| Day | Height above horizon (°) | Day | Height above horizon (°) |
| 1 | 19 | 12 | 14 |
| 2 | 19 | 13 | 14 |
| 3 | 18 | 14 | 13 |
| 4 | 18 | 15 | 13 |
| 5 | 17 | 16 | 12 |
| 6 | 17 | 17 | 12 |
| 7 | 16 | 18 | 11 |
| 8 | 16 | 19 | 11 |
| 9 | 16 | 20 | 10 |
| 10 | 15 | 21 | 10 |
| 11 | 15 |
a) Draw a graph of the height of Ceres above the horizon in degrees, using the data from the chart above. Draw a straight line through the points.
Answer:
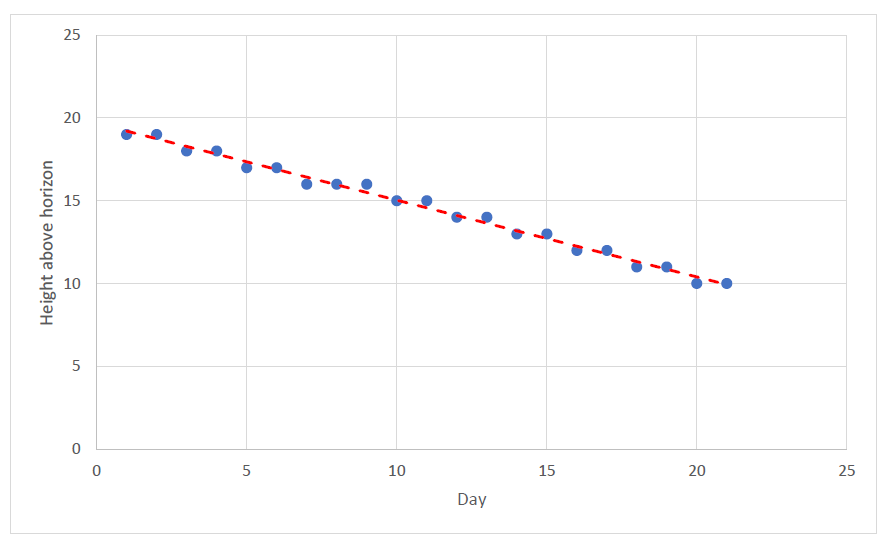
b) Calculate the straight line’s tilt and its point of intersection with the axis y. Assuming that it is best to draw points with a straight line, what is the equation for these data?
Answer: Between the 1st and the 21st day (20 days) is the height’s difference (falls in) 9°, e. i. the straight line’s tilt is 9° / 20 = -0,45°. The point of intersection with the axis y is 19. The equation of the straight line is: y = −0,45 x + 19.
c) Determine in how many days Ceres will be below the horizon. (Clue: An object sets if its height above the horizon is 0°.)
Answer: The set of Ceres is a moment when the height above the horizon is 0°, e. i. y = 0. We solve an equation and look for the x for which y equals 0. We can write down
0.45 x = 19
x = 42
Ceres sets in 42 days.
Exercise: Orbital trajectory of dwarf planet Pluto differs from orbital trajectories of planets – eccentricity 0.25, inclination 17°. The eccentricity of planets’ orbital trajectories is from 0.007 (Venus) to 0.206 (Mercury), in fact, most planets’ eccentricity is smaller than 0.1. The inclination of the orbital trajectory to the plane of the ecliptic ranges in most planets from 0° (Earth, from the definition of the ecliptic) up to 7° (Mercury). That is, Pluto gets, in a short phase (from the 7th February 1979 until the 11th February 1999) of its trajectory, closer to the Sun than Neptune, if we project its orbital trajectory into the plane of the ecliptic.
a) Assume that Pluto moves on a circular orbital trajectory. Calculate what per cent of time is Pluto closer to the Sun than planet Neptune? How many days is it?
Answer: Orbital time of Pluto is 248 years. Pluto is closer between the years 1979 and 1999, that is 20 years. Considering accuracy, the calculation is sufficient on the level of years, so 20 / 248 = 8%. From 7 February to 1979 to 11 February 1999 it is 7309 days = 20 years · 365 days + 5 days for leap years (1980, 1984, 1988, 1992 and 1996) + 4 days (from the 7th day in the month to the 11th day in the month).
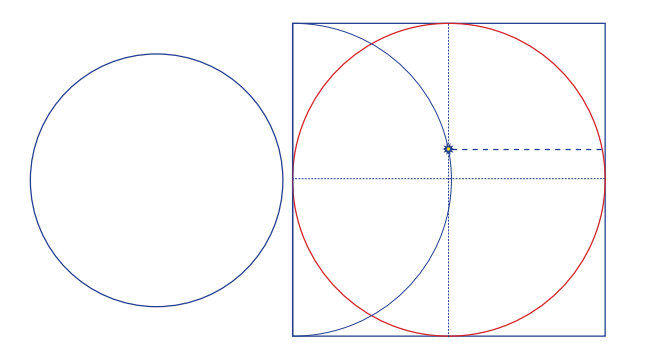
b) On the models of the Neptune’s and Pluto’s trajectories verify that Neptune and Pluto cannot collide. Make a simple model of the trajectories of planet Neptune and dwarf planet Pluto. On a sheet of paper size A4 draw a circle with the radius 7.5 cm which will represent Neptune’s orbital trajectory. Cut out the drawn circle and in one spot cut up to the center of the circle. On another sheet of paper create the trajectory of Pluto; we recommend to draw a rectangle with sides 19.8 cm and 19.2 cm in an application (you can do so also in a text editor) on the computer. Draw an ellipse into it in such a way that the ellipse touches all the sides of the rectangle. Mark both axes of the ellipse with dash-dotted lines. You will get the position of the Sun if you draw a semi-circle with the diameter 19.8 cm around the center of the longer side of the rectangle and find the point of intersection with the longer axis of the ellipse. Finally, draw a perpendicular to the longer axis of the ellipse in such a way that it crosses the Sun. Print the picture in the proper racio on the A4 sheet of paper, cut out the trajectory including the drawn perpendicular. Insert both models of the trajectories one into the other in such a way that they form an angle of 17°.
Exercise: Your weight depends on the gravitational force of the location where you are. The chart below shows what gravitational force would be like in various locations in the Solar System compared to the figure (1.00) on Earth’s surface. If somebody’s weight on Earth is 100 kg, his or her weight on Mars would be 17 kg. We will get the figure the following way: 100 kg (“weight” on Earth) multiplied by 0.17 (gravitational factor for Moon) = 17 kg. It is necessary to bear in mind that the mass does not change in various places, it is always the same. Only the weight changes as it is related to gravitational force.
Your weight on Earth: 100 kg
| Location | Gravitational factor on surface (Earth = 1.00) |
My “weight” in this location |
| Sun | 28 | 2 800 |
| Mercury | 0,38 | 38 |
| Venus | 0,9 | 90 |
| Earth | 1,0 | 100 |
| Moon | 0,17 | 17 |
| Mars | 0,38 | 38 |
| Ceres | 0,029 | 2,9 |
| Jupiter | 2,53 | 253 |
| Saturn | 1,1 | 110 |
| Uranus | 0,9 | 90 |
| Neptune | 1,14 | 114 |
| Pluto | 0,06 | 6 |
It is necessary to remember that in reality it is not possible to land on gas planets and the Sun because they do not have a solid surface. Put the list of locations in order according to where your “weight” is heaviest to the lightest. What parameter does the change of your “weight” depend on?
Answer: The Sun, Jupiter, Neptune, Saturn, Earth, Venus, Uranus, Mercury, Mars, Moon, Pluto, Ceres. The change depends on the gravitational factor which is influenced by object’s mass, its dimension (gravitational force) and the rotational period, object’s dimension (centrifugal force).
Exercise: In this exercise we will test how planet’s mass influences a high jump.
Instructions:
1. Pupils will create groups of three.
2. One pupil in the group holds a one metre long ruler vertically to the floor in such a way that the root of the ruler’s scale touches the floor.
3. Another pupil in the group watches the scale and notes down the height of the jump of the third pupil in the group.
4. The third pupil in the group jumps up next to the ruler. The height of the jump is noted down and repeated all together three times. From the three heights the average jump height is calculated and written in the form and will be considered the jump height on Earth.
5. Pupils will change their roles in the group, that means that each of them will jump and his/her average jump height on Earth will be noted down.
| Jump | Try #1 | Try #2 | Try #3 | Average jump |
| Height (cm) | 53 | 50 | 47 | 50 |
6. Calculate average jump height in other locations in the Solar System with the help of Table 2.
7. Complete Table 3 by writing down planets, the Sun and dwarf planet Pluto and the height of your jump based on the mass of the object from the least massive object to the most massive object.
8. Create a bar chart with jump heights, ordering the objects ascending according to the object mass.
Table 2: How jump height is influenced by mass of an object of Solar System
| Object | Mass of object of Solar System (× 1023 kg) |
Average jump height on Earth(cm) |
Conversion factor for jump height |
Jump height on object (cm) |
| Sun | 19 900 000 | 50 | ×0,036 | 1,8 |
| Mercury | 3,3 | 50 | ×2,63 | 132 |
| Venus | 48,7 | 50 | ×1,11 | 55,5 |
| Earth | 59,7 | 50 | ×1 | 50 |
| Moon | 0,73 | 50 | ×5,88 | 294 |
| Mars | 6,42 | 50 | ×2,63 | 132 |
| Ceres | 0,0094 | 50 | ×34,5 | 1 730 |
| Jupiter | 19 00 | 50 | ×0,40 | 20 |
| Saturn | 5 680 | 50 | ×0,91 | 46 |
| Uranus | 868 | 50 | ×1,11 | 55,5 |
| Neptune | 1 020 | 50 | ×0,88 | 44 |
| Pluto | 0,13 | 50 | ×16,7 | 835 |
Use the above stated masses to order Solar System objects from the least massive object to the most massive object and write them in the Table below. In the table, write also the jump height of every listed object.
Table 3: Order of Solar System objects according to mass
| Solar system object | Jump height on object |
| Ceres | 1 730 |
| Pluto | 835 |
| Moon | 294 |
| Mercury | 132 |
| Mars | 132 |
| Venus | 55,5 |
| Earth | 50 |
| Uranus | 5,55 |
| Neptune | 44 |
| Saturn | 46 |
| Jupiter | 20 |
| Sun | 1,8 |
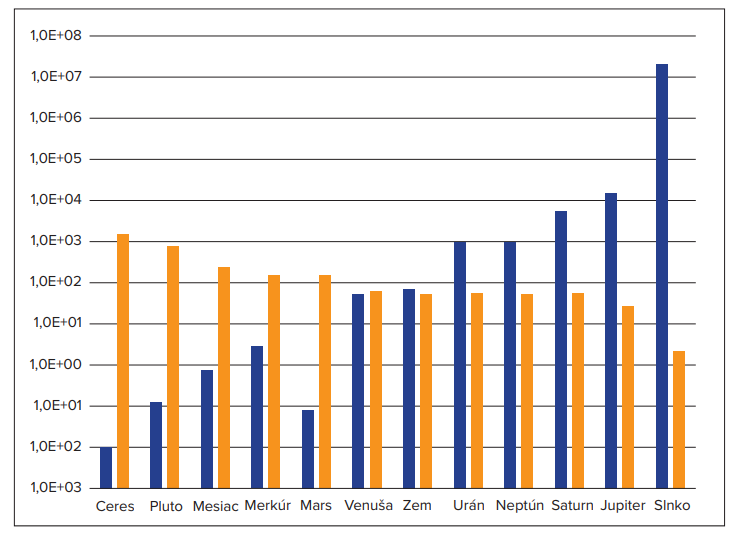
Use the data from the tables above and create a bar or a line chart which will compare the mass of the objects of the Solar System and the height of your jump. On the vertical axis, order the objects from the least massive object to the most massive object.
Answer:
Exercise: Which object of the Solar System is it possible to jump highest on and on which object the jump height is lowest?
Answer: It is possible to jump the highest on dwarf planet Ceres and the lowest on the Sun. However, the Sun does not have a solid surface, nor do the gas planets. Thus, Earth could be considered the correct answer.
Exercise: Why is it possible to jump higher on Mercury than on Neptune?
Answer: On Mercury, lower gravitational force acts on us, and that is why we can jump higher there. It is recommended to point out that Neptune is a gas planet and does not have a solid surface.